Variants
Variants represent ways you executed your processes. Each variant is a sequence of activities that has been followed by one or more case.
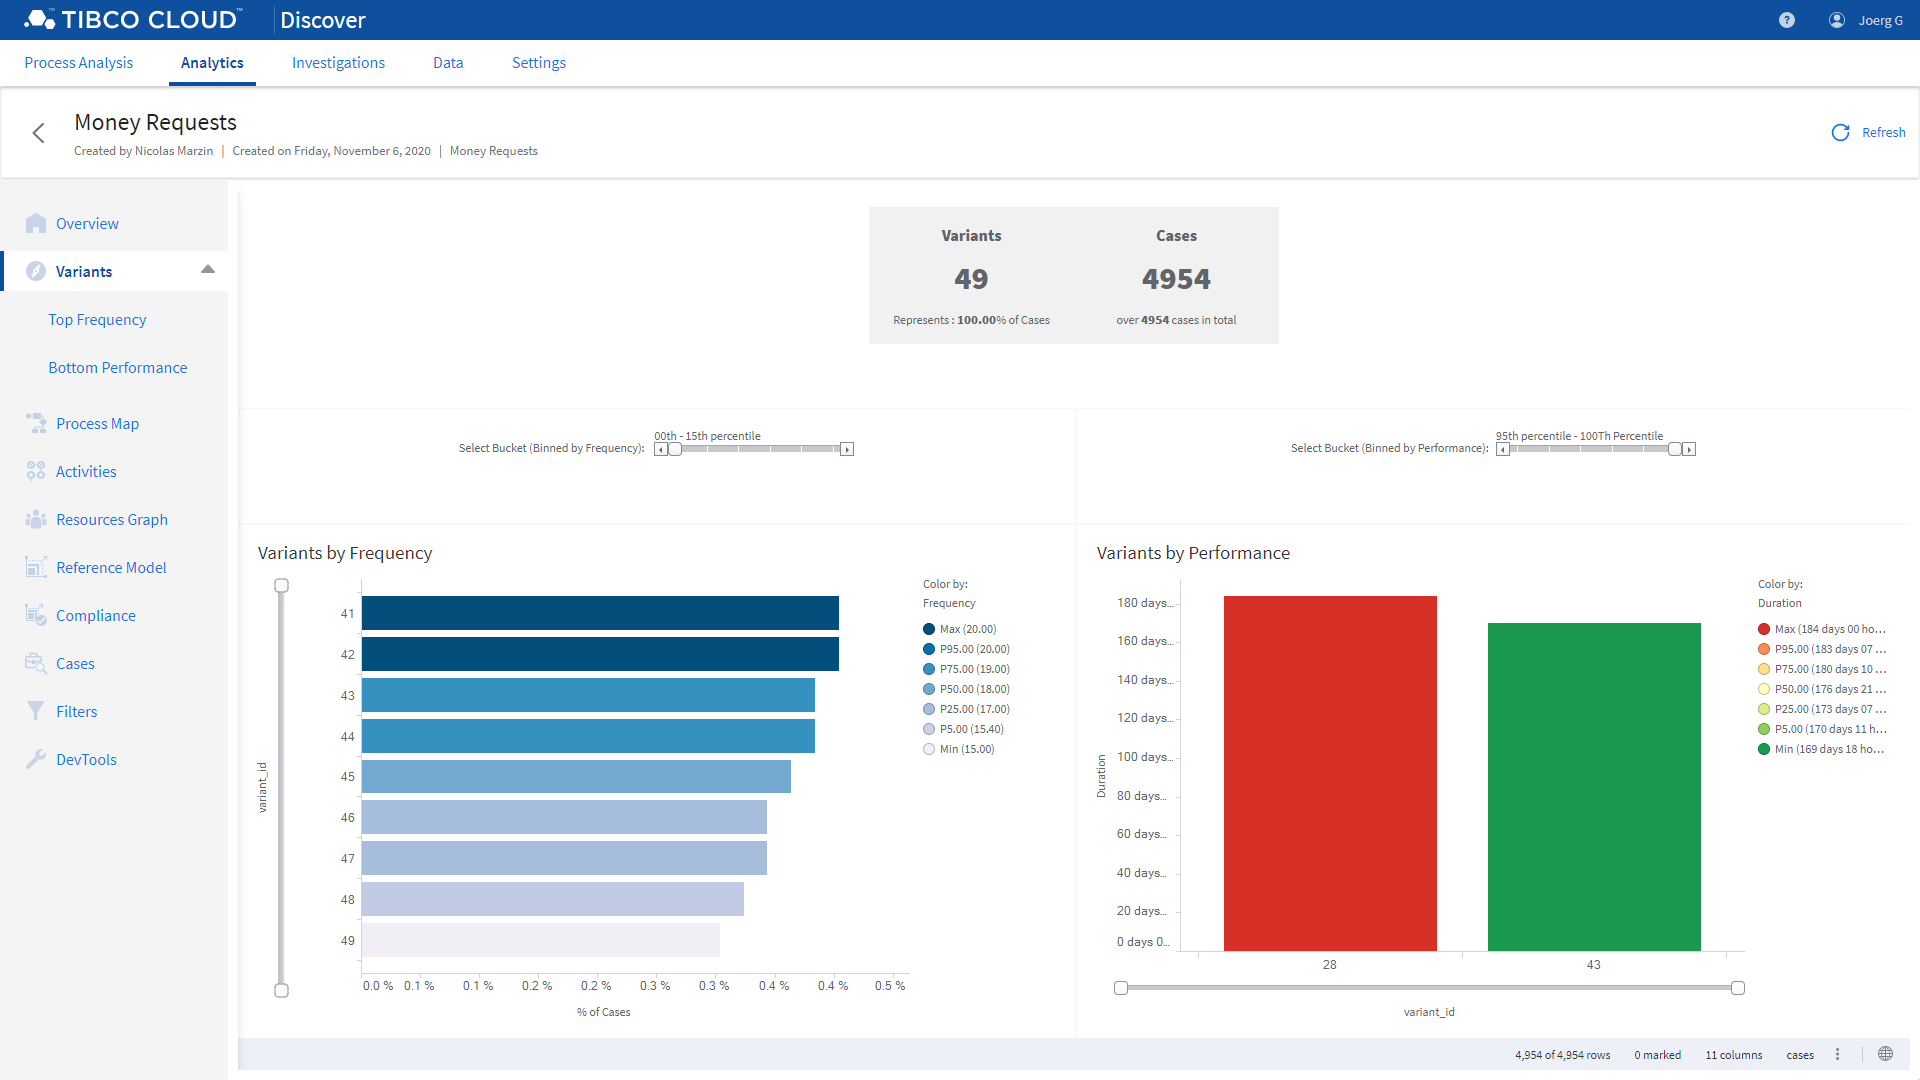
Variants can be explored, focusing on:
Select one or more variants from the table and visualize the corresponding process map.
Feedback
Was this page helpful?
Glad to hear it! Please tell us how we can improve.
Sorry to hear that. Please tell us how we can improve.
Last modified November 23, 2020: new docs (786e3b3)