Overview
The Overview tab presents a summary of the event log data.
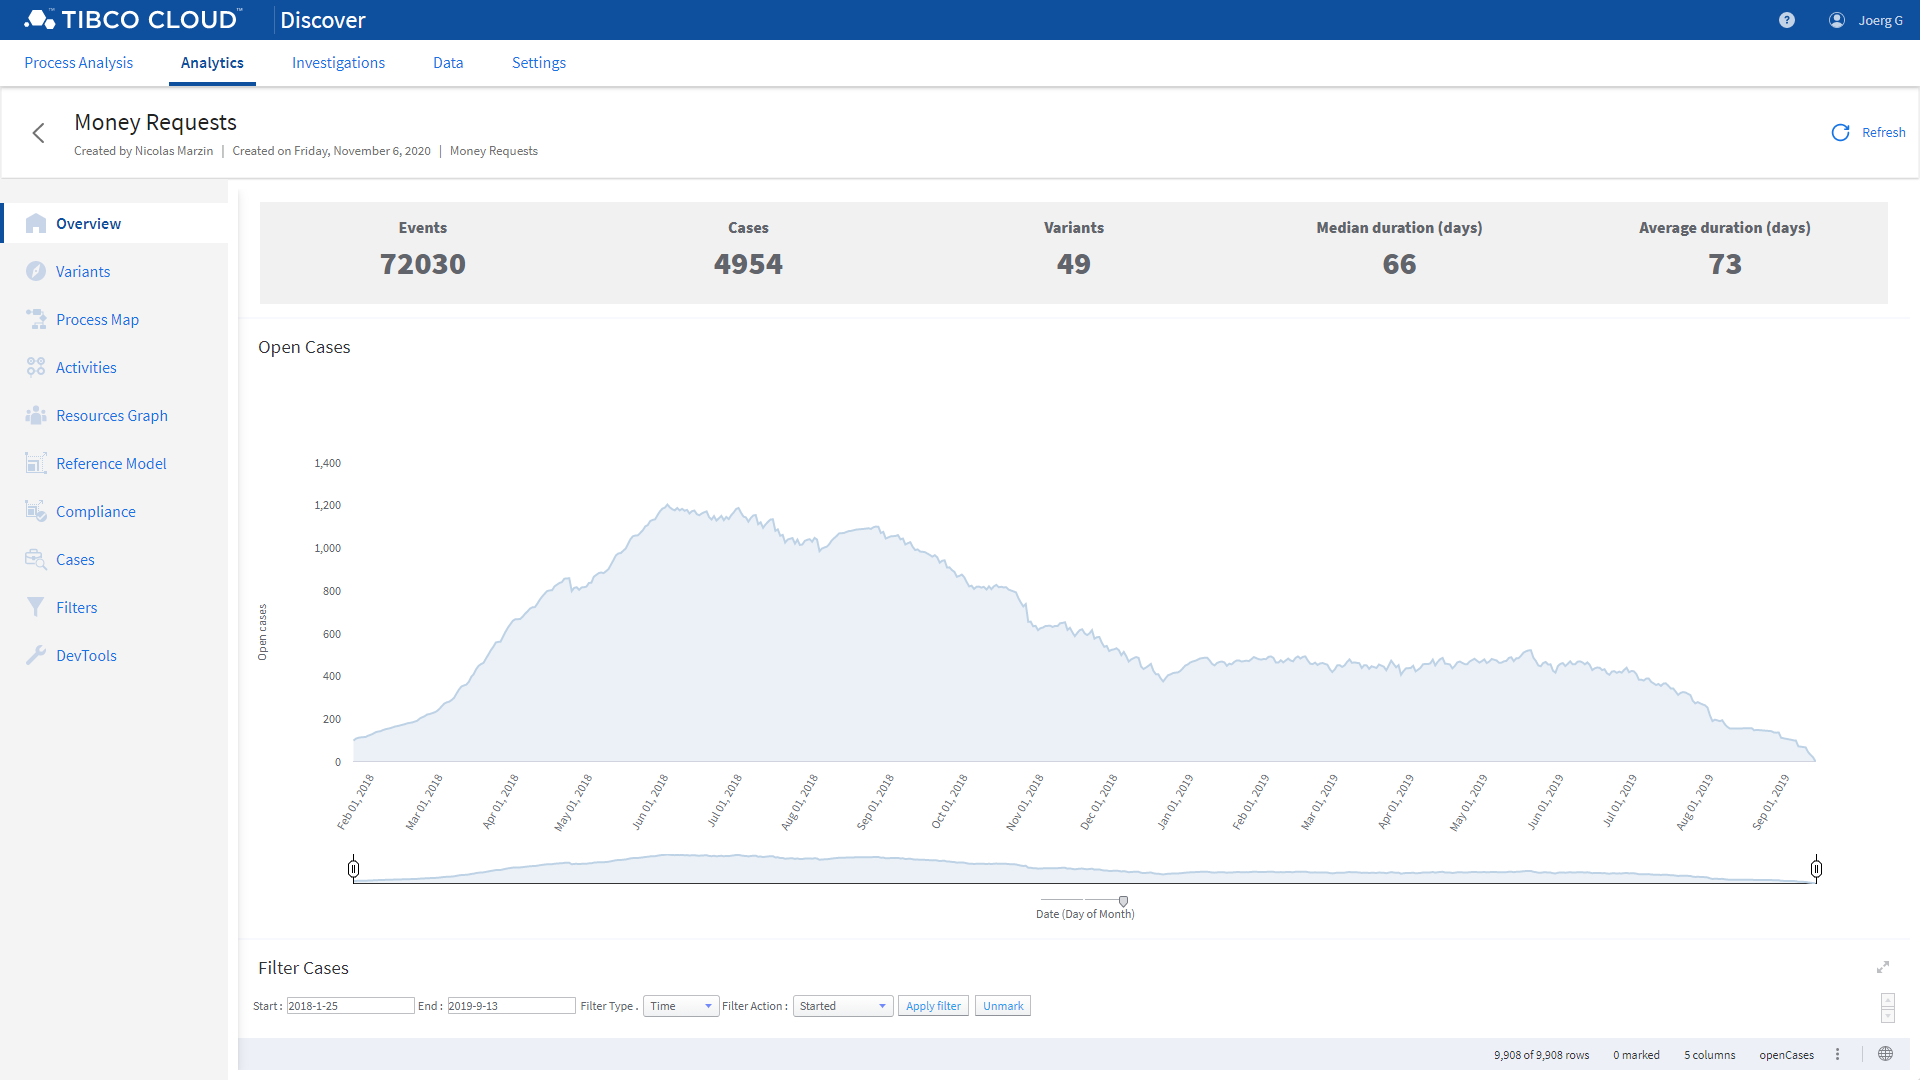
A set of KPIs allow you to quickly visualize
Open cases are also visualized on a timeline, allowing you to filter start and end times using the zoom slider and the filter panel.
Feedback
Was this page helpful?
Glad to hear it! Please tell us how we can improve.
Sorry to hear that. Please tell us how we can improve.
Last modified November 23, 2020: new docs (786e3b3)