Process Map
Process Map is a graph representing your processes. Whether it shows one ore more variants,
the purpose is to help you visualize the end-to-end flow.
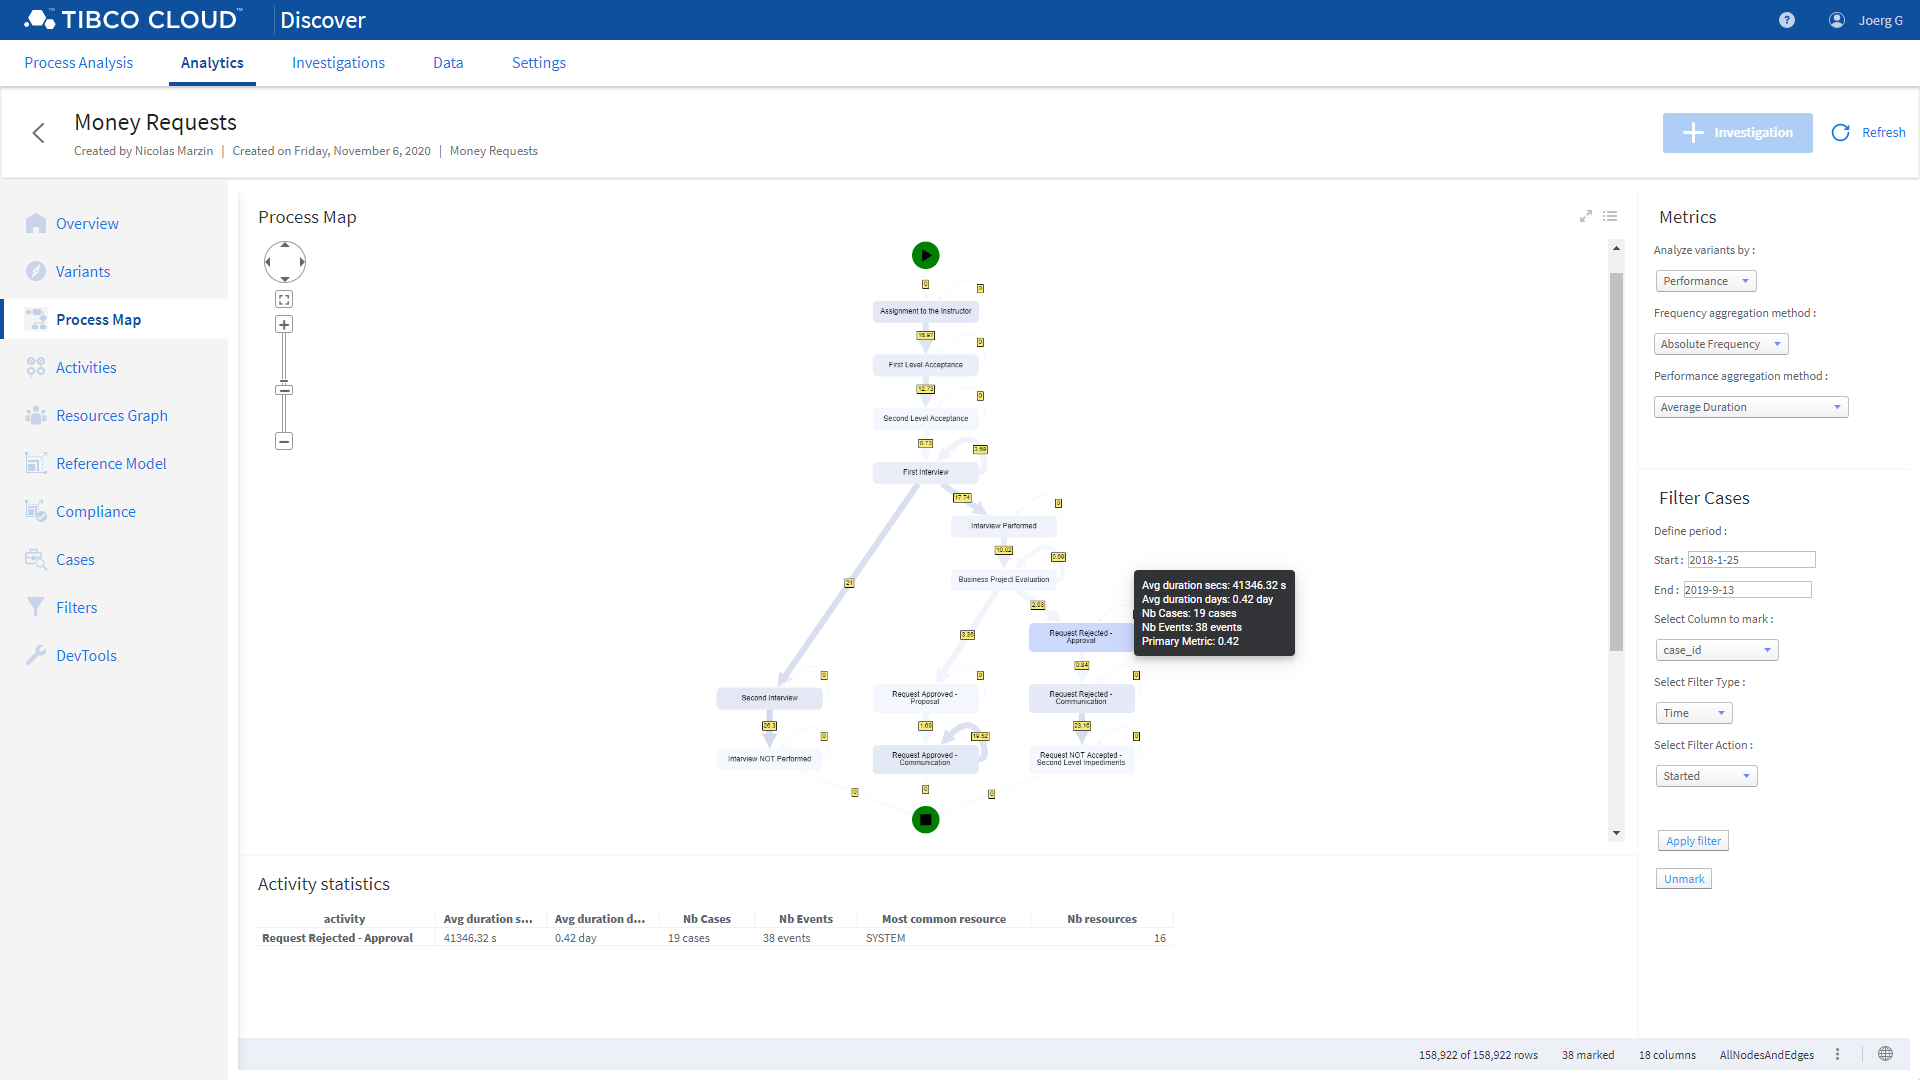
Typical features include:
Feedback
Was this page helpful?
Glad to hear it! Please tell us how we can improve.
Sorry to hear that. Please tell us how we can improve.
Last modified November 23, 2020: new docs (786e3b3)