Resource Graph
This set of visualizations focus on resources. Also known as social mining.
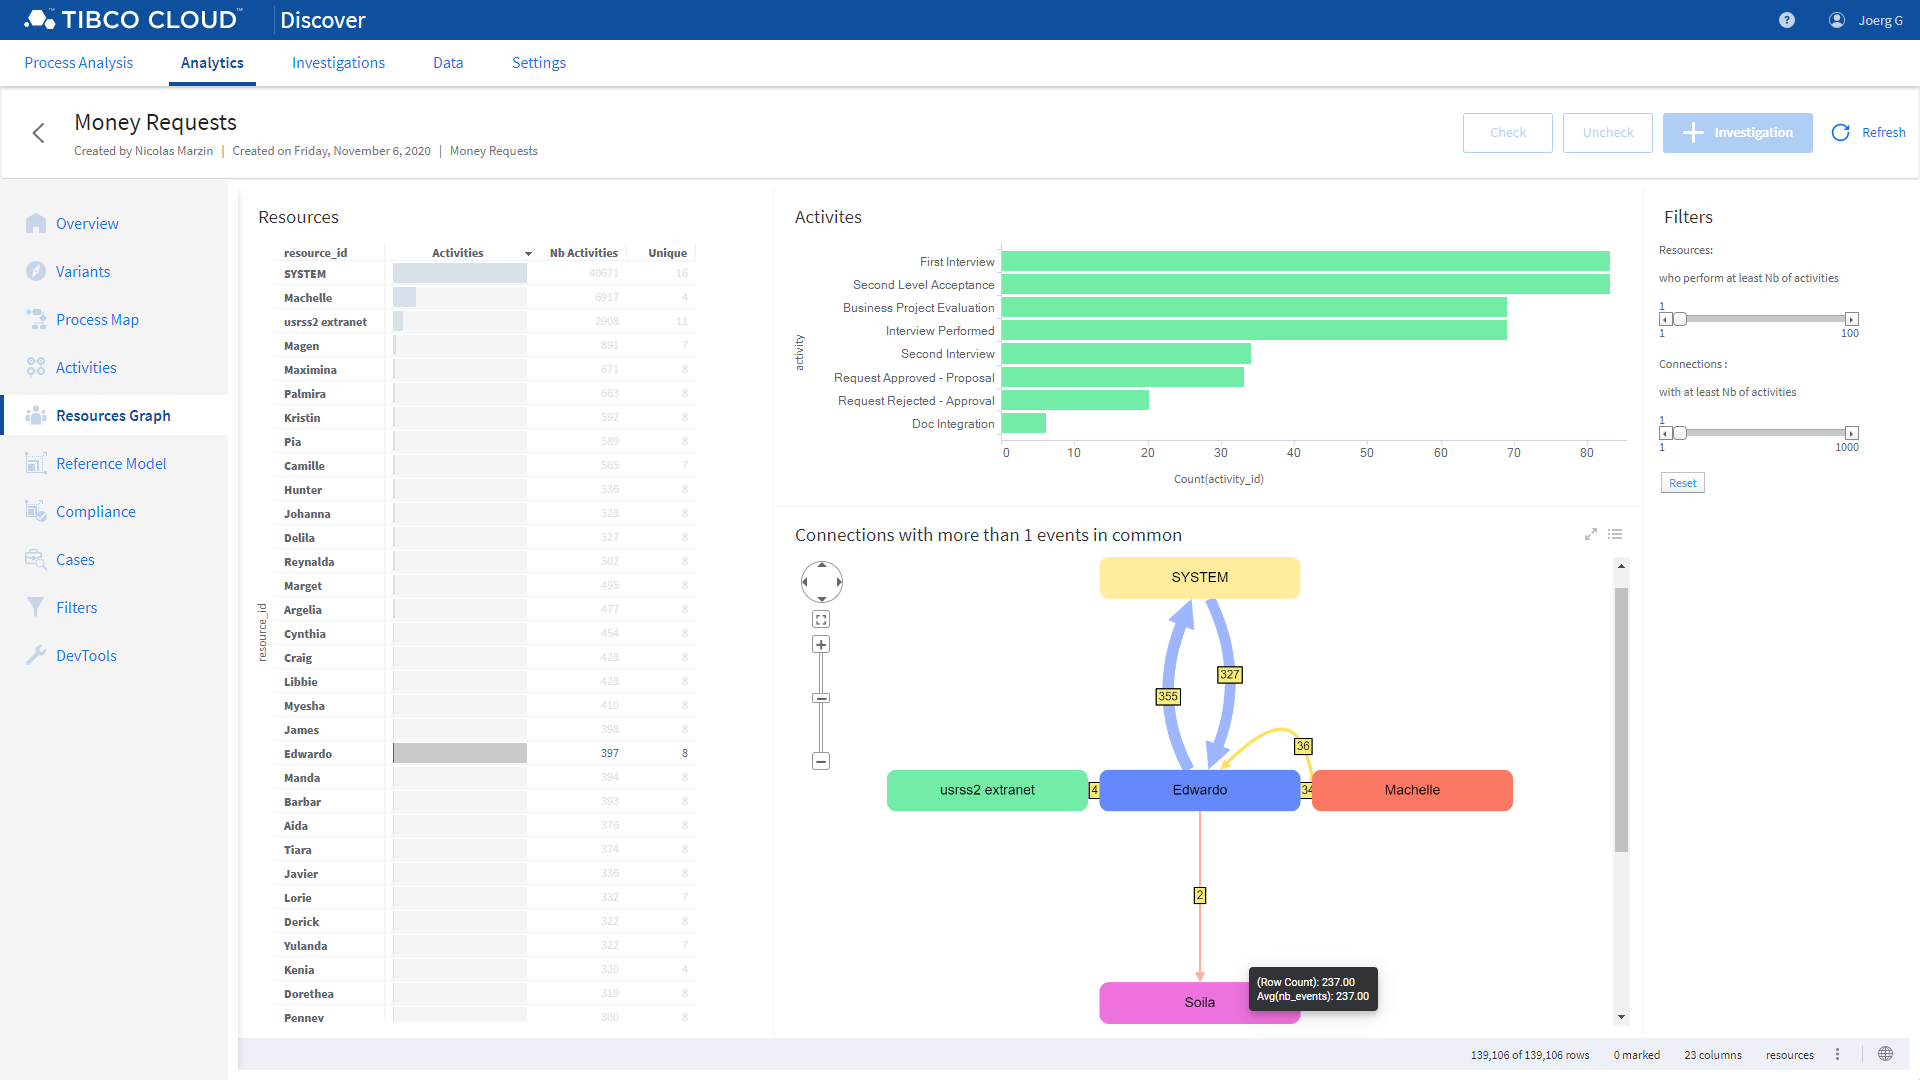
The purpose is to help discover some patterns related to how resources are involved and interact with each other in processes.
A table lists resources ranked by number of activities performed.
The graph represent resources as nodes and connections as edges. A connection between two resources represents two consecutive activities in the same case. Of course, an edge can represent more than one occurrences of such connection, for one or more cases.
A filter panel allows
Feedback
Was this page helpful?
Glad to hear it! Please tell us how we can improve.
Sorry to hear that. Please tell us how we can improve.
Last modified November 23, 2020: new docs (786e3b3)