Inspecting Devices
TIBCO Project Air has the capabilities to inspect edge devices metadata as well as data generated by those devices. Device Metadata provides information about the device and all the instruments (sensors, actuators) associated with the device. It provides information on all the operations available on the devices as well as the type of data generated by the devices. This section will guide you through all the steps to inspect device metadata as well as how to visualize data generated by the devices.
Prerequisites
Prerequisite 1: Edgex Connection
In order to access device metadata, Project Air needs to be configured to access an Edgex Gateway. See Manage Device Groups
Prerequisite 2: Device Groups Configuration
Before you can see device data, make sure the messaging protocols and data stores configuration for device groups have been configured. See Configuring Device Groups.
Inspecting Device Metadata
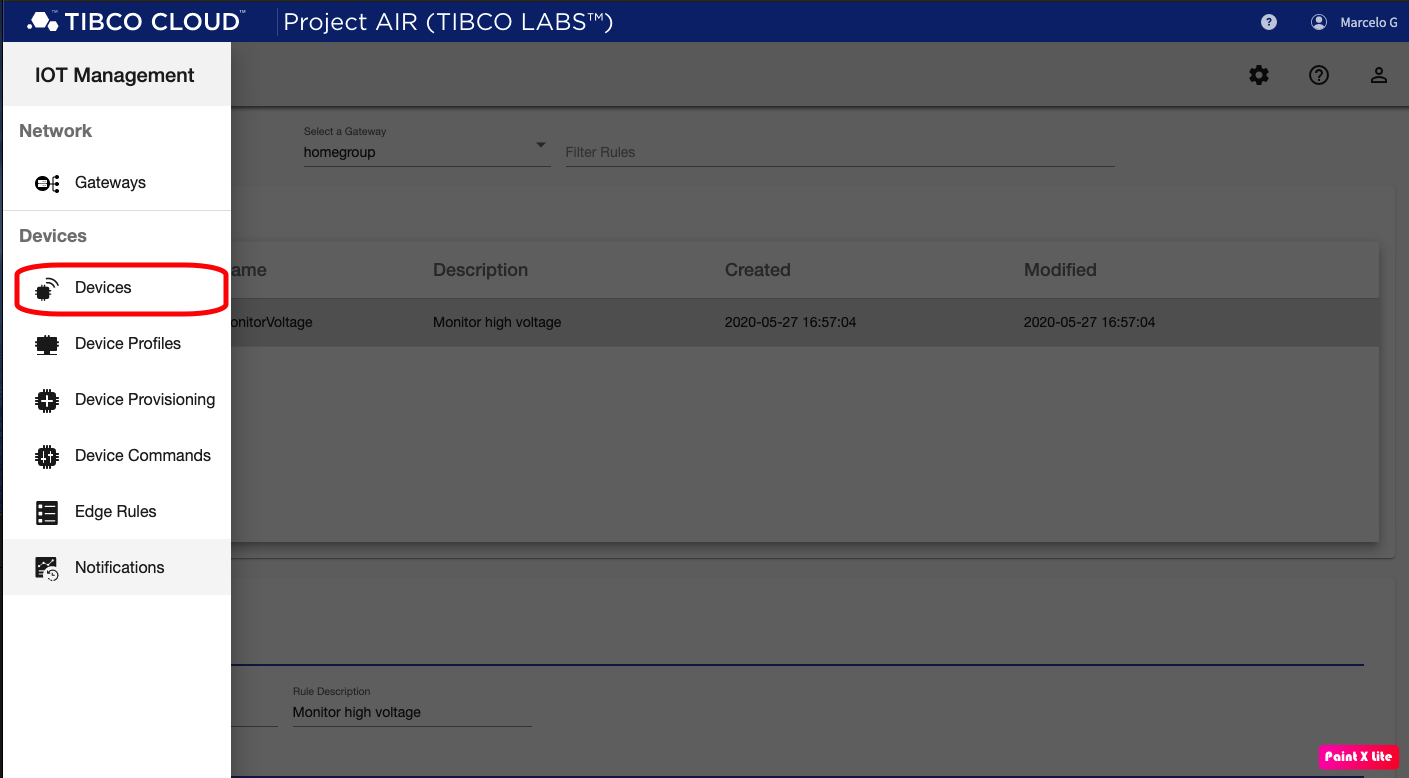
Step 1: From the Main Menu, select Devices.
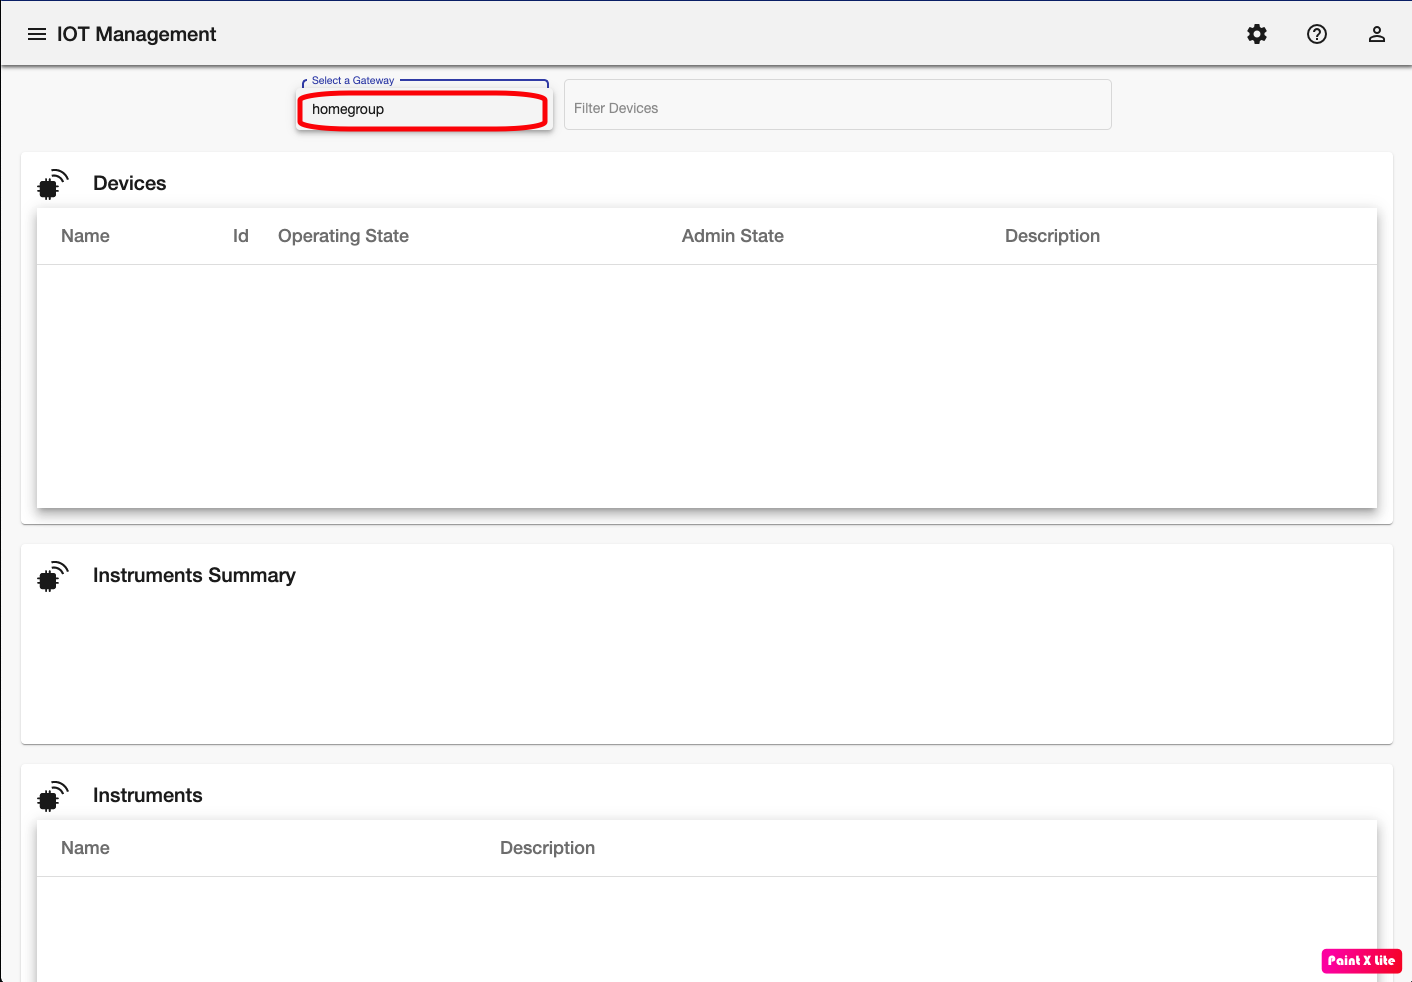
Step 2: Select the Device Group for the devices you want to inspect.
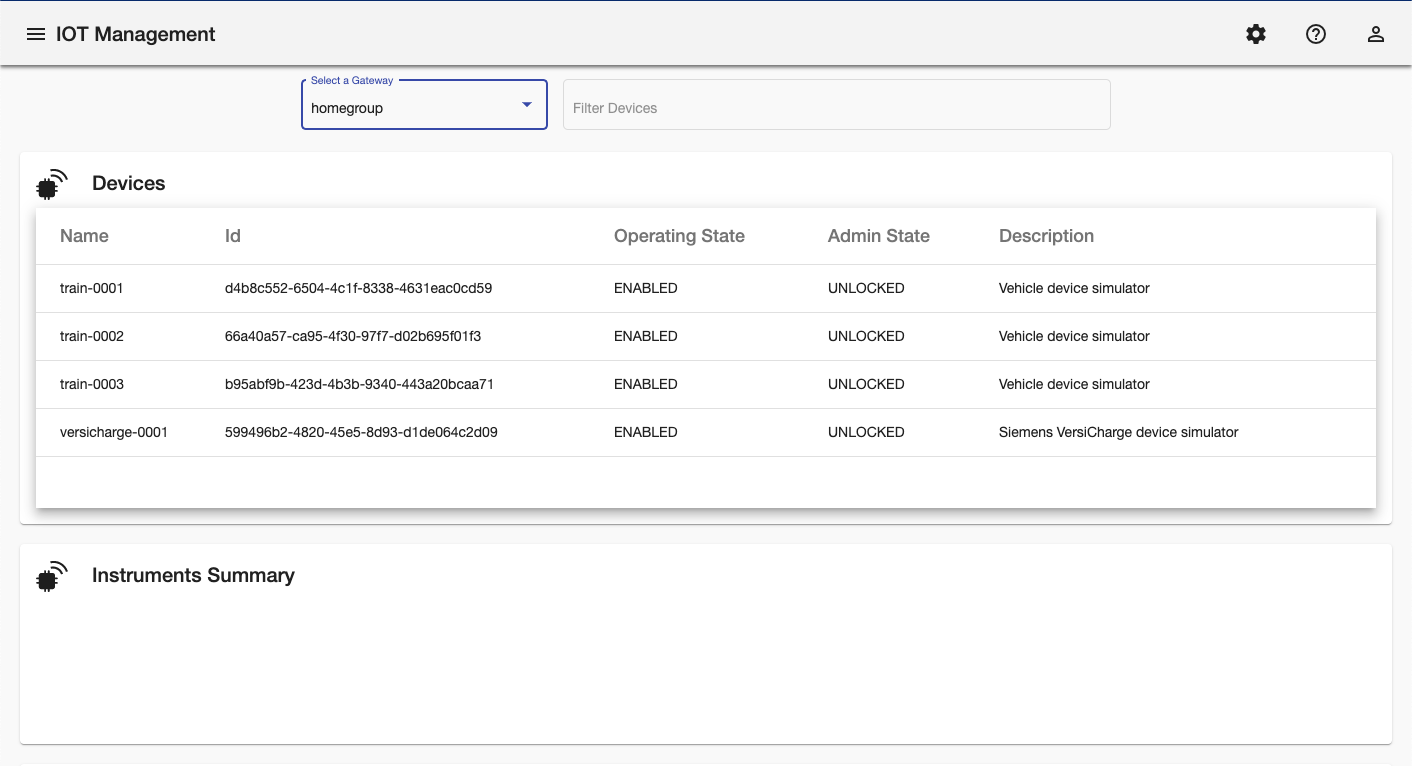
Step 3: Viewing all devices
The list of devices available will be displayed. Now you can select any of those devices to see the metadata and data details
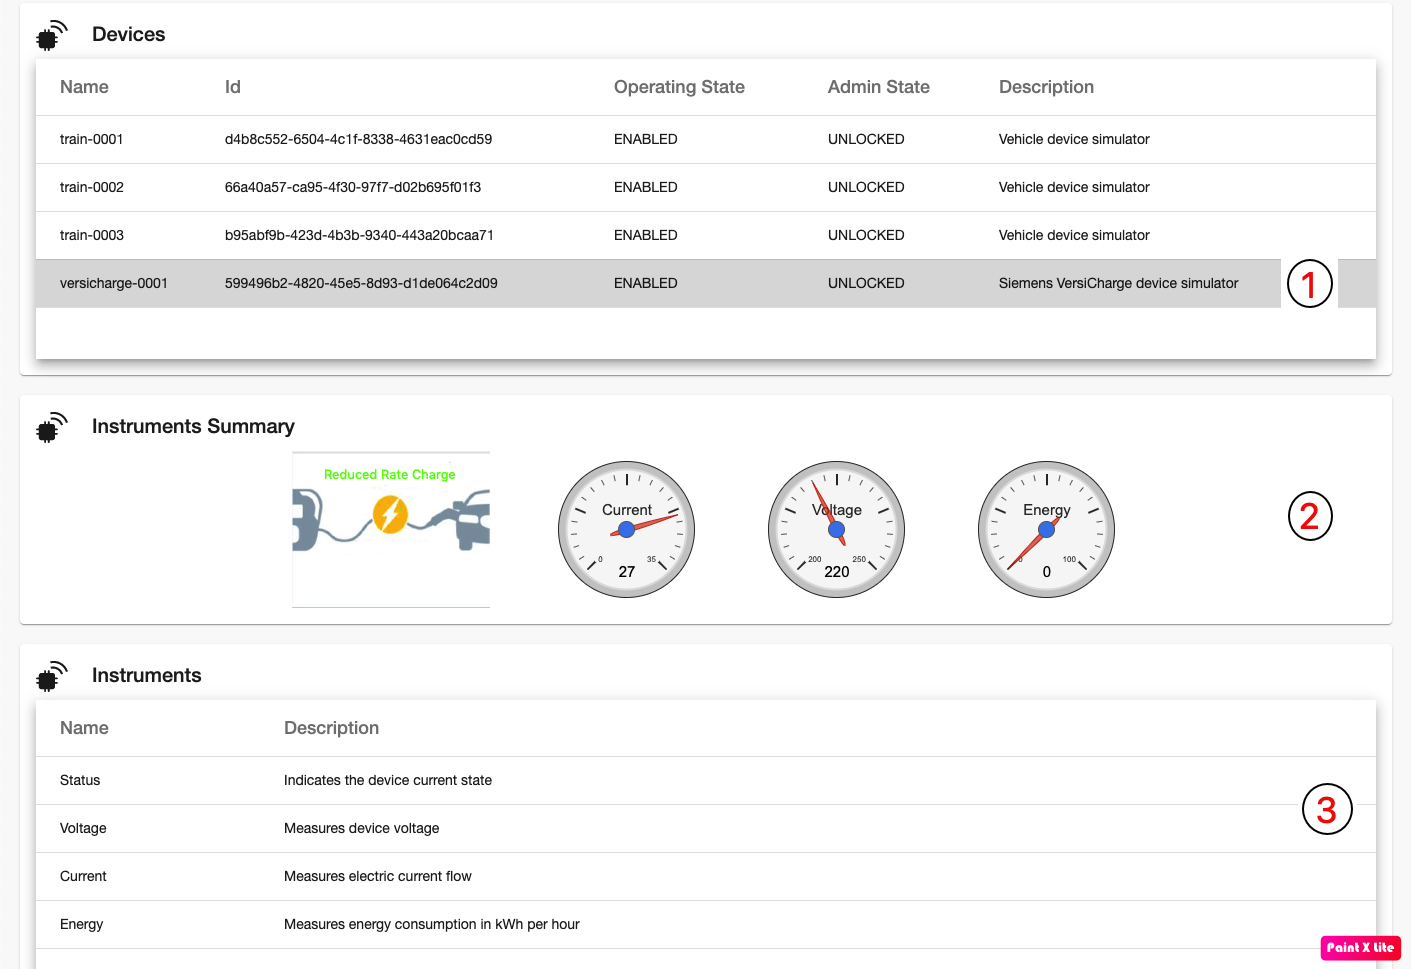
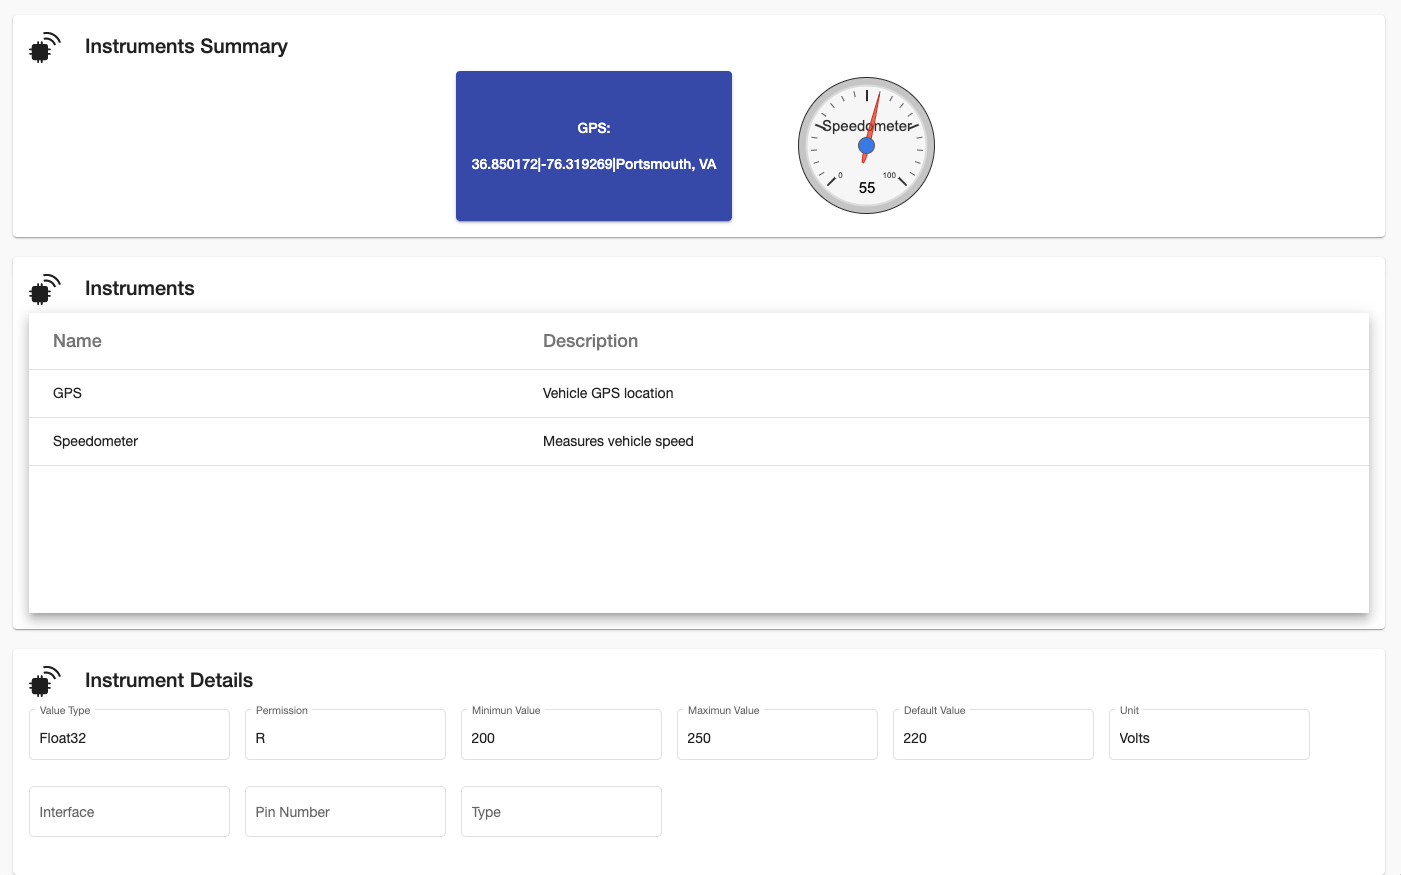
Step 4: Inspect Device Latest Data and Metadata
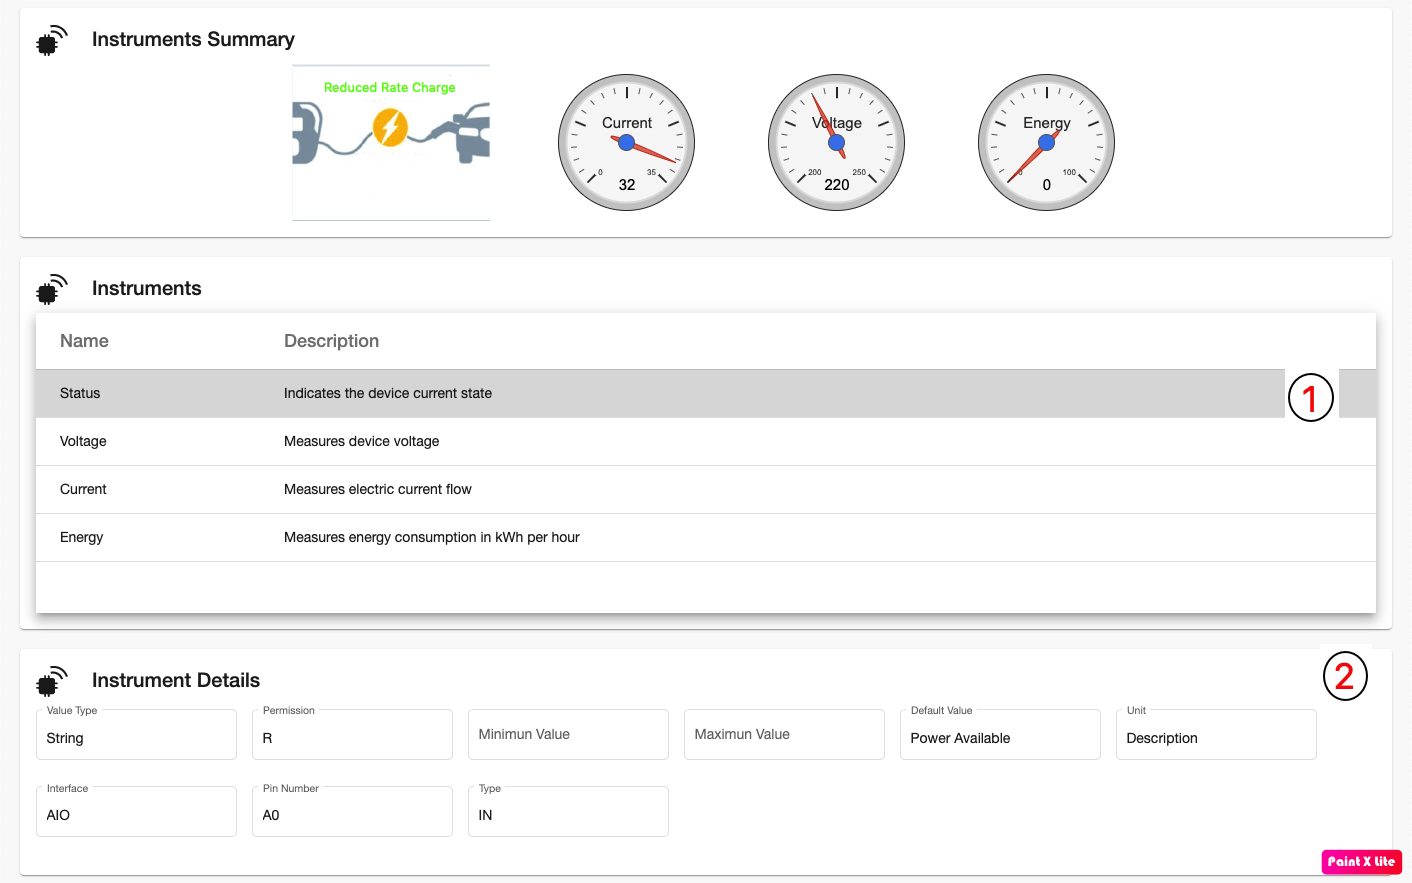
Select a device from the Devices table (1) to see a summary of the current data sent by the device instruments (2) and a list of the instrument with a description for each of them (3)
Step 5: Inspecting Device Metadata
Select an instrument from the Instruments table (1) to view the device metadata information (2) like data value type, minimun value, maximun value, etc.
Step 6: Visualizing Data
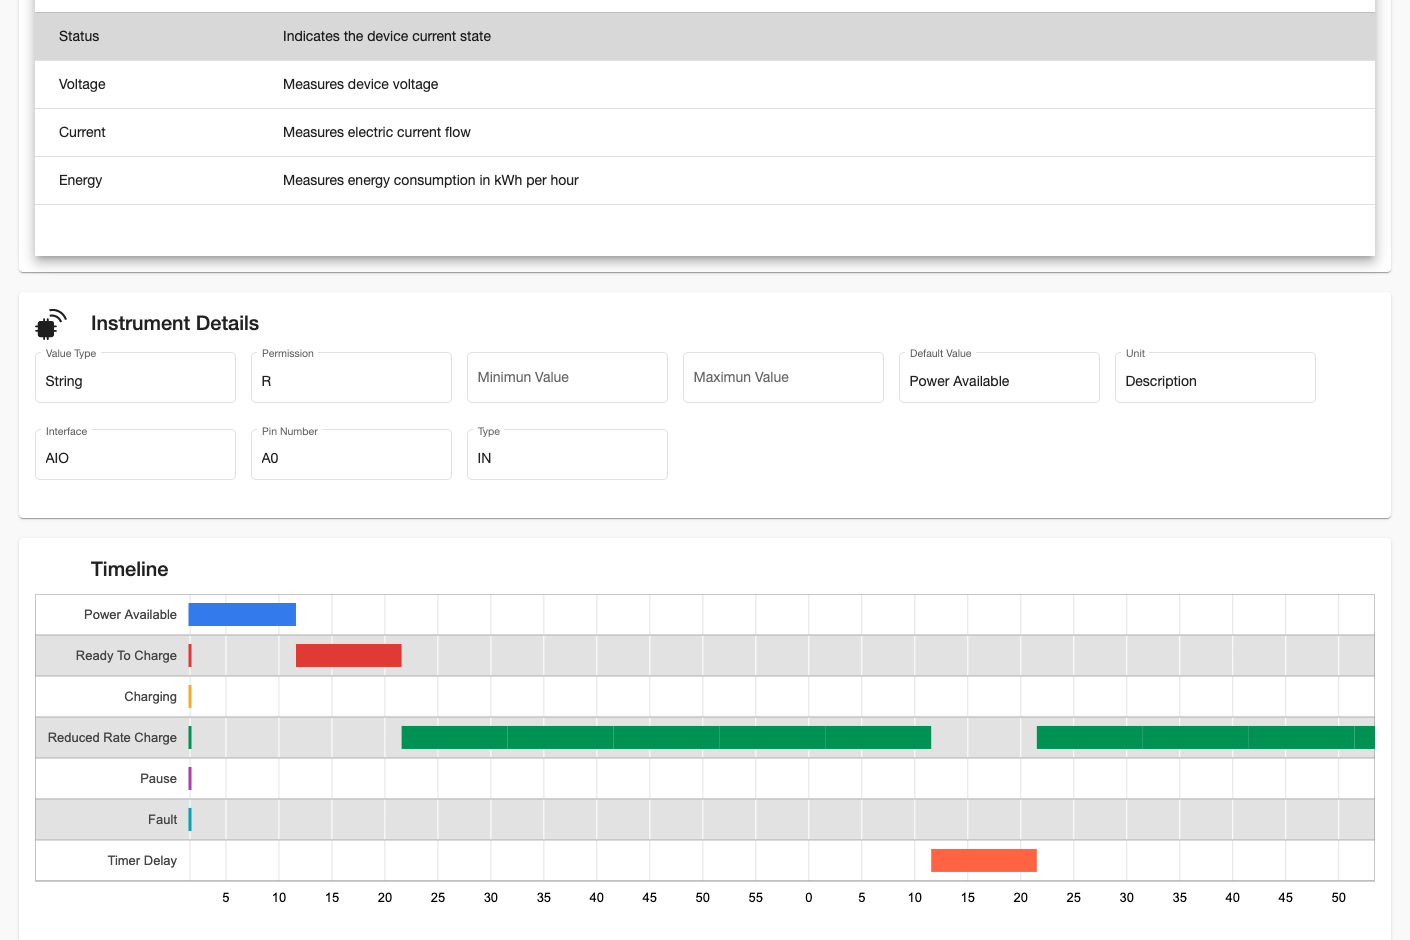
Data will also be visualized. Data is viewved depending the data type. For example, for an instrument emitting status information (discrete value), a timeline is displayed showing the different states and times the instrument has been on that state.
Step 7: Visualizing time series data
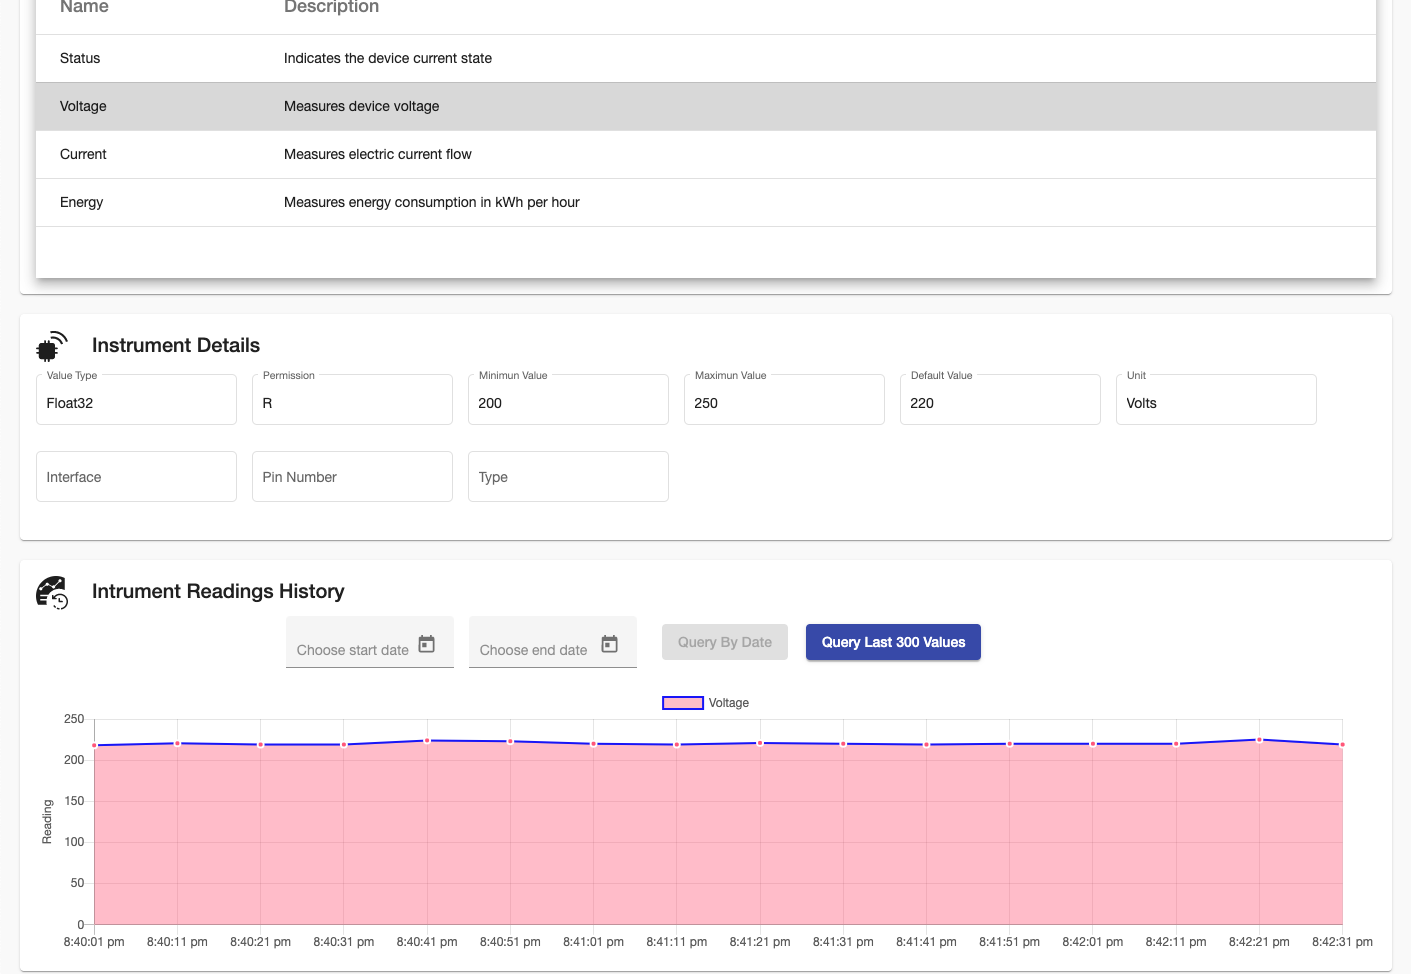
Selecting a different instrument, the metadata and data information will be displayed. For example, the Voltage instrument emits numeric data. In that case, a chart with a history of values is displayed.
Step 8: Viewing Streaming Data
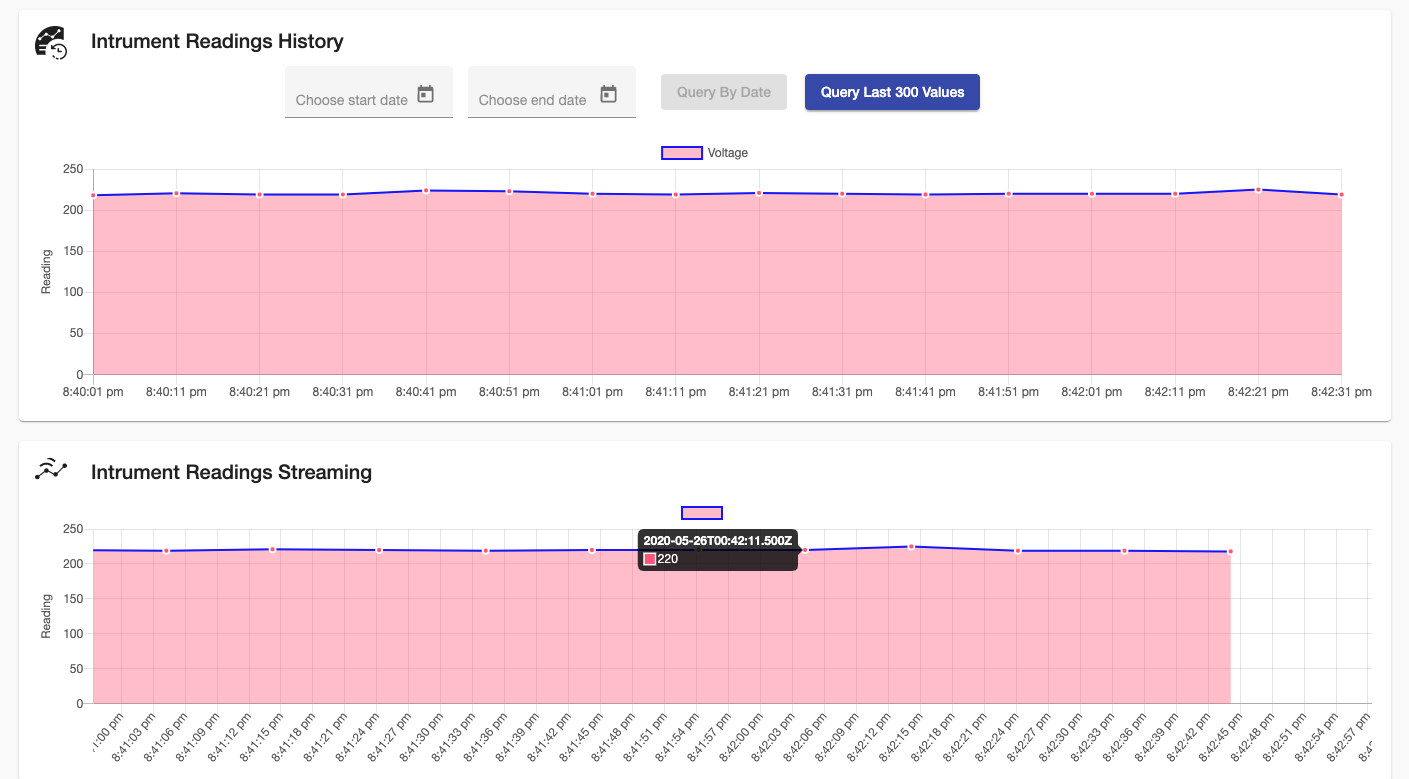
If the device is transmitting data, the last chart will display an streaming chart with the latest values transmitted by the device
Step 9: Visualization for different data types
As indicated previously, different visualization can be used for different data types. In this example, data from a vehicle will be shown
Step 10: Visualizing geo location data
Selecting an instrument with geo location data will display the position of the instrument on a map.

Feedback
Was this page helpful?
Glad to hear it! Please tell us how we can improve.
Sorry to hear that. Please tell us how we can improve.